In the next few days, I’ll be upgrading my north facing access point from Engenius to Ubiquiti. The firmware is already written, and I have most everything prepped for the rooftop mount. Before I post about working with the (hidden) Ubiquiti 5.3 SDK, I thought I’d give a quick tour of my system so far.
With Midtown Wifi I had the following goals:
- Work more in the C language.
- Build a stable and (mostly) embedded captive portal system with a minimal ToS acceptance screen.
- Let the surrounding neighborhood use the Internet for free in exchange for helping me build and test the system.
- Use the system as a way to introduce neighbors, let them post local interest items (missing pets, crime reports, events, etc).
- Provide maps of recently reported crimes via the Harrisburg, PA online Police Blotter.
Over the years I’ve accomplished all of this, to one degree or another. Harrisburg, PA is in the midst of some serious financial problems, so their online police blotter has gone away – preventing me from easily obtaining local crime information. People are what they are, and as Google+, MySpace, and any other Social Site knows — getting people to truly use your social portal is a trick that requires sheer genius. Getting them to log into it and push a “Free Wifi” button however, is easy.
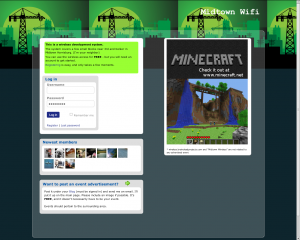
How it works:
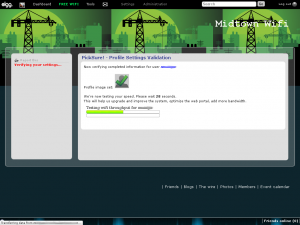
After connecting to one of the open access points, the end user is redirected (courtesy of a patched NoDogSplash) to a captive web portal. The web portal is based off Elgg, a fairly easy to use Social Network Engine written in PHP. I’ve made a few modifications to the base system, adding a more recent JQuery and JQueryUI (so that I can create interactive Dialogs), and writing a few plugins to handle Netflow display, wireless signal strength reports (per user), user speed tests, and to verify that they have a picture set before allowing them to use the Free Wifi.
By nature, people won’t set a profile picture when all they want is Free Wifi. I had to enforce a profile picture (“it doesn’t have to be you, it can be anything non-offensive”) to make the site NOT appear like a barren wasteland.
I eventually limited account creation strictly to the access points as registrations from outside those IPs were mostly just spam.
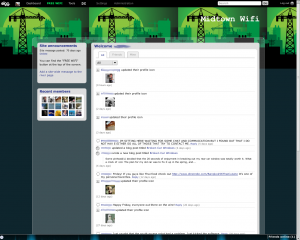
After a user creates an account and logs in, they are directed to the “Dashboard”, which is a listing of recent posts from any of the users. Most are quick “Hey you!”, but sometimes people post something more substantive. When my rear car window was broken, I used the system as a venting forum.
I’ve consolidated most of my customizations relative to the wireless users into a single Elgg plugin I named “TSA Patdown”. Initially TSA Patdown only verified that a user had a profile image set, but now it does quite a bit more. Every 30 seconds I export Received Signal Strength Indication (RSSI) for each client from the Engenius equipment. I collect this information, as well as information from a Javascript based speedtest widget I wrote to get an idea as to what kind of online experience each user is having.
I represent this information to myself on the following menu, with signal bars that I created using Blender:
I can further delve into information on a per-user basis by simply clicking on a name. I can also pull a full neighborhood report, graphing each clients RSSI values as well as their recent speedtest results.
Being implemented in Javascript, the speedtest results aren’t the same as you’d see when visiting a Flash based speedtest. The standard web method of performing such a test is to have the end-user download an image file or two (oftentimes two images simultaneously)- and at random intervals determine how much of the image has been downloaded by that timeframe. With a single image download, it can perform multiple measurements at various intervals and determine available bandwidth much more accurately. Since there’s additional overhead in the underlying TCP/IP layers, it appears most tests also add padding to their calculation to make things more accurate.
Flash has methods that will allow for such periodic sampling, Javascript however does not. This makes my Javascript implementation an overall average – so a report of 900Kbit/sec can easily represent 1.5Mbit/sec. (My results are much more akin to what Wireshark will report as throughput). I do plan to write a Flash based speedtest in the near future.
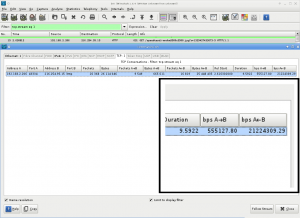
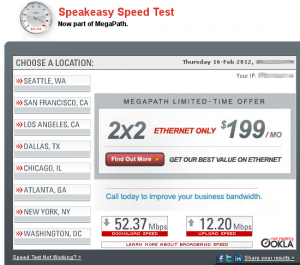
In this example, the capture in Wireshark measures the throughput as 21.22Mbit/sec, nowhere near the 52.37Mbit/sec rating given by Speakeasy. The recent throughput information is all displayed in the signal screen:
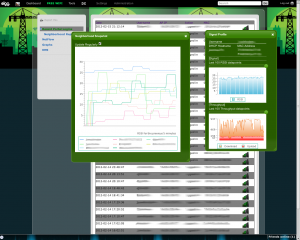
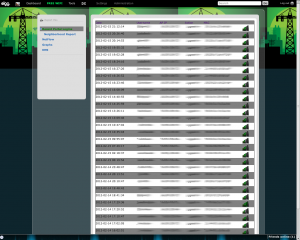
The Netflow section of my TSA Patdown plugin details the current traffic flow on the network. This screen updates dynamically as users surf the internet. (I’ll reiterate my past posts here: The netflow data is only packet endpoints… basically “this person called this person at this time”, but not the actual content of those conversations). I’ve also added a small port-based protocol disector that colorizes the flows and provides protocol information depending upon the packet you select. If you choose a NetBIOS packet, you’ll get something similar to this:
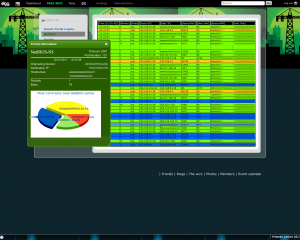
The system monitors for NetBIOS names as well as DHCP hostnames that appear on Midtown Wifi. All of this information comes together to paint an accurate view of the network.
Clicking a Protocol Name (in this instance NetBIOS) will direct you to a Wikipedia article on the protocol and how it works. Unclassified protocols can be classified and colorized with a simple click. You can also specify the URL to load when the protocol name is clicked.
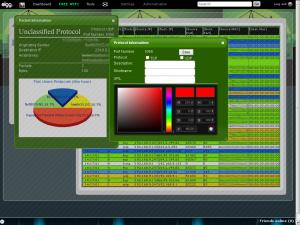
The pie charts, RSSI graphs, and throughput graphs are all handled using the PHP JPGraph libraries. In the future, I intend to improve the graphs (there are tendencies for my labels to bleed off-screen or over each other).
The access points share their own ADSL line for bandwidth but maintain individual PPPoE sessions. The wiring in my home needs improvement (the house was built in the 1800’s, the Cat5 running through the house is obviously not that old but does have some serious issues) . Most of the exterior walls appear to be metal, which does hinder re-running the DSL line a bit.
I recently migrated my home network graphing from NetMRG to Cacti, and I’m using Cacti‘s (albeit poor) FTP export function to offload graphs pertaining to MidTown Wifi to the captive portal.
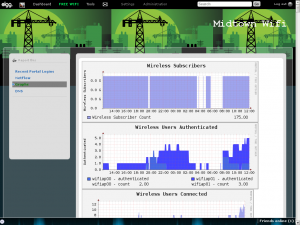
As you can see in the graphs, the system currently has 175 subscribers. I have deleted the bogus accounts that weren’t created through the APs. The high number of subscribers is largely the result of transient users (my home is on a major bus line, rental homes in the area turn over somewhat frequently, the local college is blocks away, etc). A couple of users have duplicate accounts having apparently lost their credentials (as is evidenced by a few repeat MAC addresses).
To put the large number into proper perspective: in the last 7 days there were 157 logins by 18 unique users. Unlike myself, most of the users don’t spend every waking moment on the Internet.
I’ve covered the access points and the firmware images in a number of previous posts, so I’ll let them speak for themselves. In the next few days (hopefully not weeks), I’ll be introducing my first Ubiquiti access point to the system with full details posted then. If you have any thoughts or input, by all means reach me in the comments section.


